Search this blog!

Friday, July 6, 2012

In MATLAB figure, how to change the X or Y axis ticks or labels?

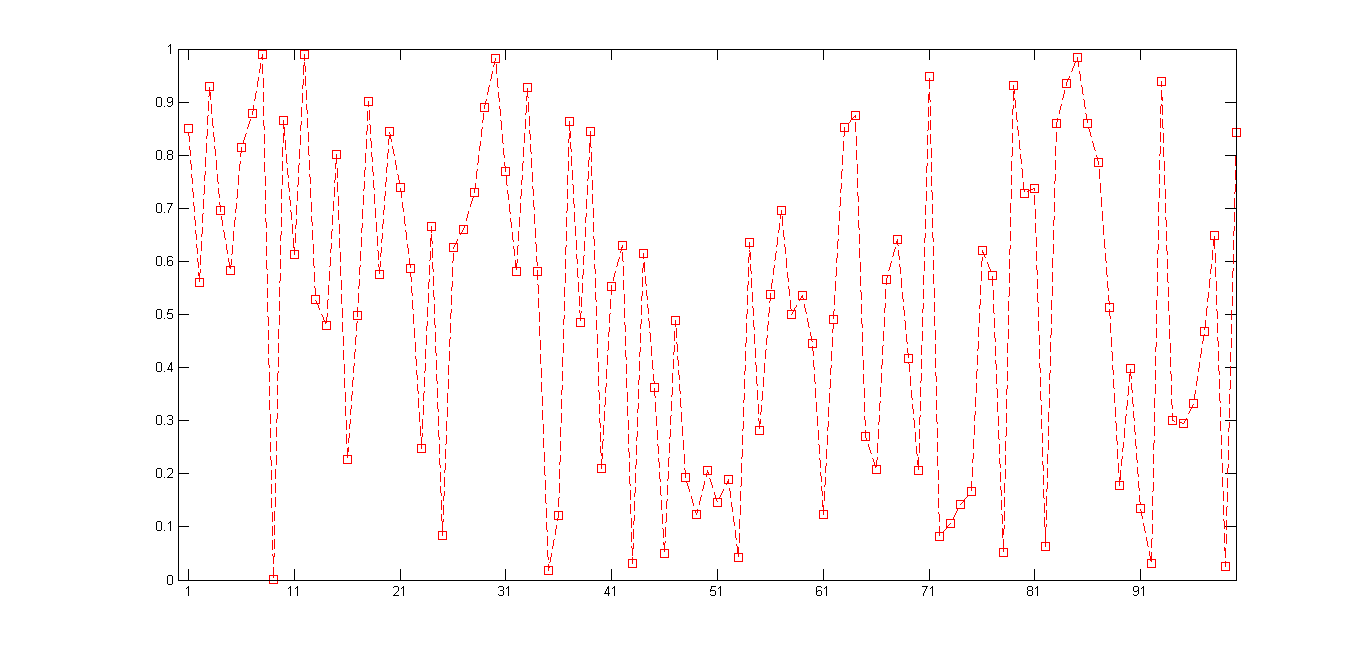
A default case is the following where I plot 100 random numbers

%%%%%%%%%%%%%%%%%%%%%%%%%%%%%%%%%%%%%%%%%%%%%%%%%%
var=rand(1,100);
figure; plot(1:100,var,'--rs');
%%%%%%%%%%%%%%%%%%%%%%%%%%%%%%%%%%%%%%%%%%%%%%%%%%

In X axis, the labels are placed 10 places apart.....0....10....20....30..... like that....If I want to have labels 2 places apart  1...3...5....7 till 100 how may I do it?


%%%%%%%%%%%%%%%%%%%%%%%%%%%%%%%%%%%%%%%%%%%%%%%%%%

set(gca,'XTick',1:10:100) % Here gca refers to the handler of the current figure's axis

%%%%%%%%%%%%%%%%%%%%%%%%%%%%%%%%%%%%%%%%%%%%%%%%%%


Now, try to do the same in Y-axis! Share your result :)


Thursday, July 5, 2012

How to save/print MATLAB figure in a file?

Imagine I want to print/save a matlab figure into disk. May be I want to save it in PNG format. How do I do that?
%%%%%%%%%%%%%%%%%%%%%%%%%%%%%%%%%%%%%%%%%%%%%%%%%%

file_handler=figure;
plot(randn(10,1));
print(file_handler,'-dpng', 'my_file_name.png');
%%%%%%%%%%%%%%%%%%%%%%%%%%%%%%%%%%%%%%%%%%%%%%%%%%
Check your current folder. A file named my_file_name.png should be there!


How to print variable value in title of a matlab figure?

Imagine my MATLAB figure has a title where I want to print the value of a variable. How can I do that ?


for var=1:3
figure;
plot(randn(10,1)); title(['rand number=: ' num2str(var) ]);
end
%%%%%%%%%%%%%%%%%%Out Put%%%%%%%%%%%%%%%%%%%%%%%%%%


Multiple Legend in plot/subplot

I needed multiple legend on a plot for multiple data where data sizes were different. If try classical legend you get the following


    figure
  p1=plot(I_test(:,:,1),I_true(:,:,1),'r.');
  hold on
  p2=plot(RGB_test(:,1),RGB_ref(:,1),'g.');
    legend( 'true','calculated');
It does not give what I want !! Therefore.....continue reading..


Instead try the following to have different legend

 figure
  p1=plot(I_test(:,:,1),I_true(:,:,1),'r.');
  hold on
  p2=plot(RGB_test(:,1),RGB_ref(:,1),'g.');
  legend([p1(1) p2(end)], 'true','calculated');


Legend in Subplot


Acknowledgement : here
    subplot(2,2,1);
     ph1=plot(rand(10,2),'s-');
     subplot(2,2,3:4);
     ph2=plot(rand(10,3),'o-');
     sh=subplot(2,2,2);
     p=get(sh,'position');
     lh=legend(sh,[ph1;ph2]);
     set(lh,'position',p);
     axis(sh,'off');


Monday, March 12, 2012

Matlab: legend in Errorbar

I want to generate an error bar like this. Here, I am comparing three algorithms and I need three legends. Here is how I did it


y = [2.22153808961105 2.49790518623828 2.78257964160148]; % mean or average
e = [0.539408440954881 1.23204940330217 0.813491394996712]; % 1 standard deviation
figure
errorbar(y,e,'r.');
hold on;
h=plot(1,y(1),'ro',2,y(2),'go',3,y(3),'bo');
legend(h,'feature','feature3x3','cluster','Location','Best');

Friday, February 24, 2012

In Matlab : Sorting by indexes of another sorting

Imagine, we have the following two array of numbers
A=[ 2 4 6 7 8 8];
 B=[ 5 8 2 5 0 5];
Problem:
---------
we want to sort A and then arrange B according to the index of A.

Solution:
----------

>> [sortedA,indexA]=sort(A)

sortedA =

     2     4     6     7     8     8

indexA =

     1     2     3     4     5     6


>> B(indexA)

ans =

     5     8     2     5     0     5